Week 2:
Diligent Descriptive Data
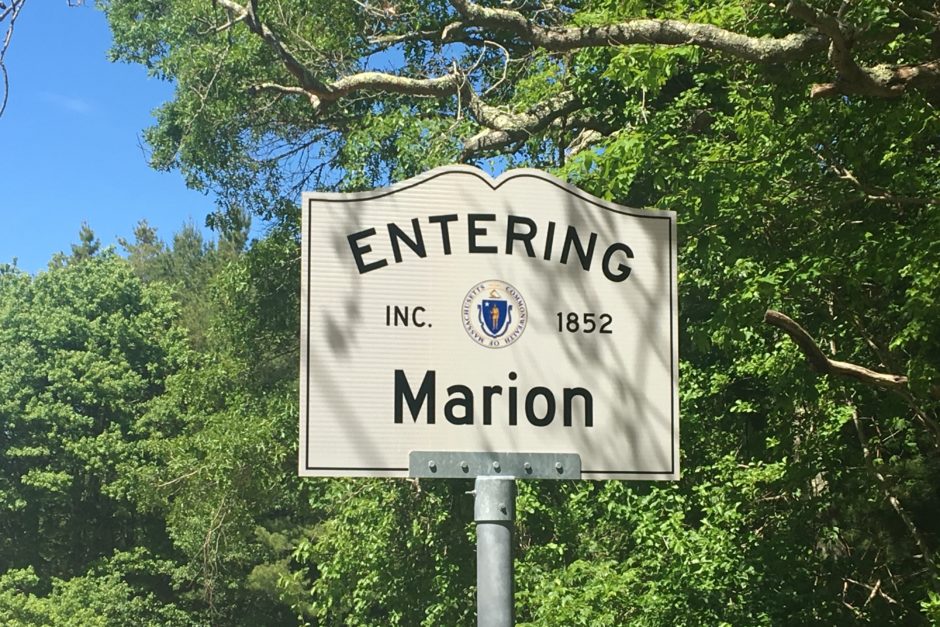
The sign welcoming visitors to Marion! Spotted while biking around the area last Saturday
June 9, 2019
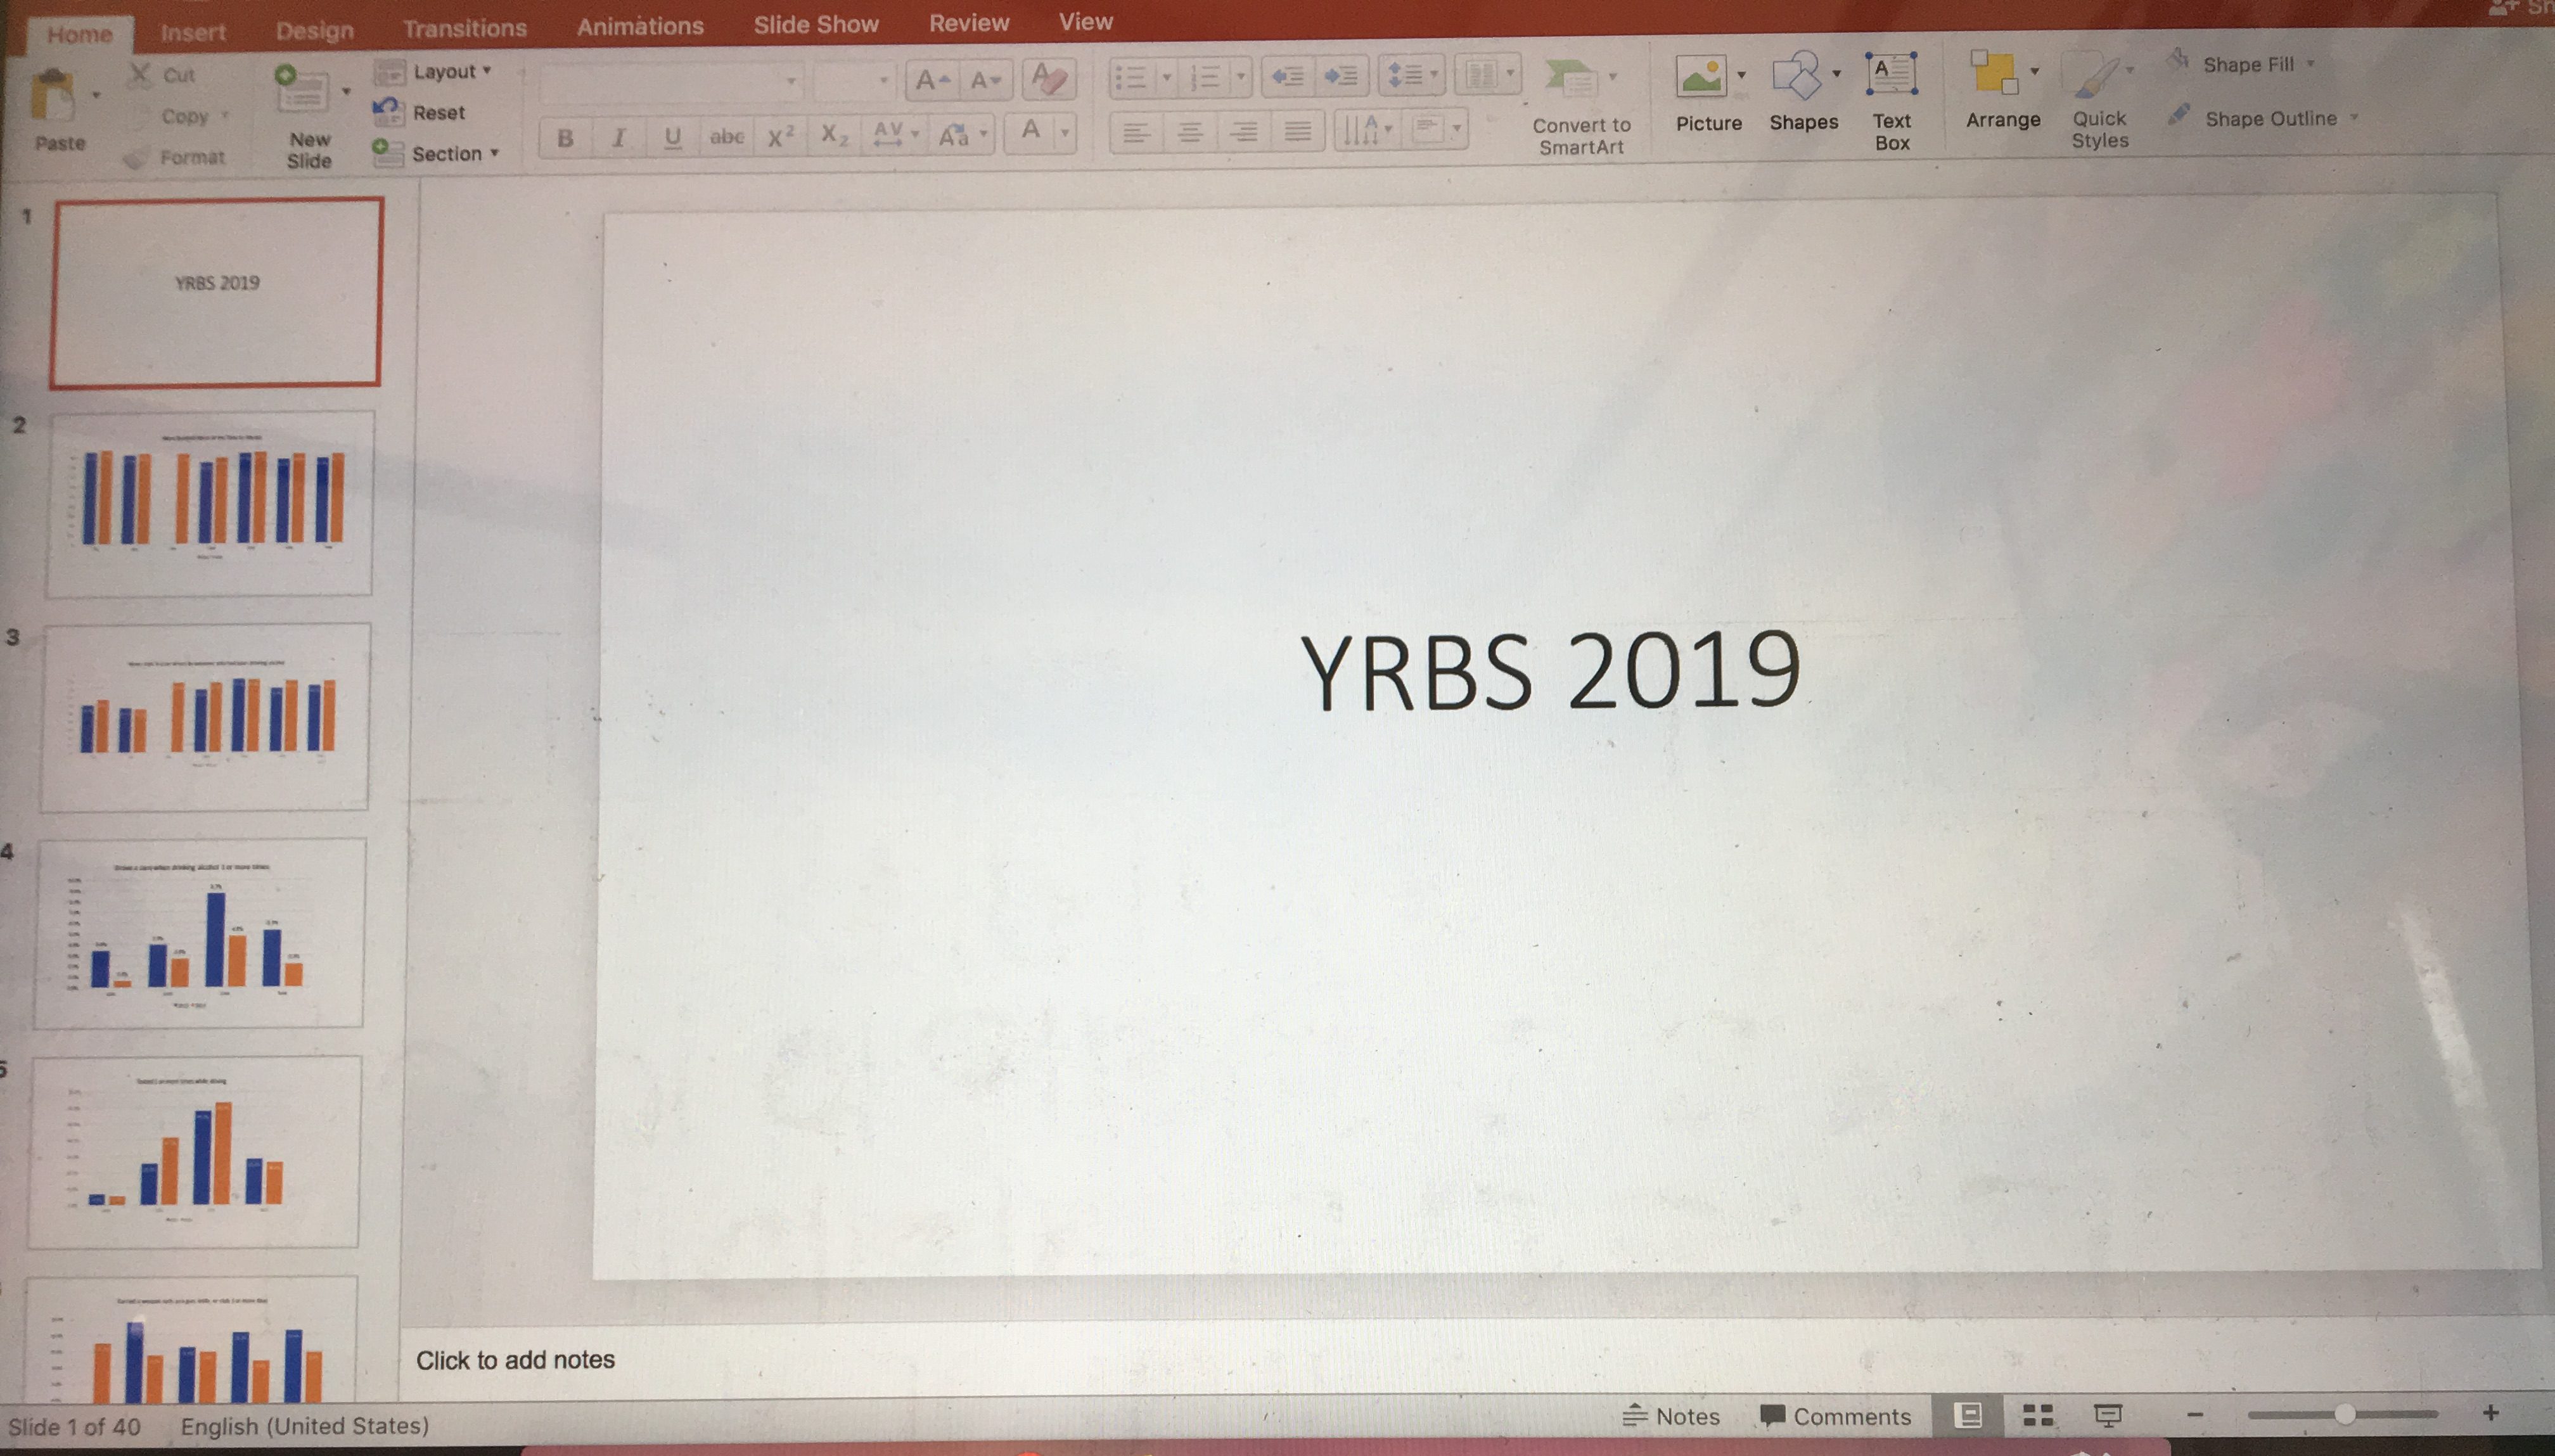
Following the first week of getting settled and learning the nuances of small-town public health, it was time to complete my first project. This week I was tasked with analyzing the Youth Risk Behavior Survey (YRBS) response data collected by the local Junior and Senior High Schools in March of this past year. The YRBS is used to determine a wide array of activities and perceptions in those between 7th and 12th grade. The questions cover topics regarding mental and physical health, substance use, and sexual health with 89 questions overall. The last time this was administered was four years ago in 2015. The results that year lead to the creation of the Healthy Tri Town Coalition, a group focused on improving the health of youth in the community. The group has since fostered incredible collaboration between the towns which populate the schools: Marion, Rochester, and Mattapoisett. Rochester and Mattapoisett are two small towns close to Marion, Rochester is to the north and Mattapoisett is to the west. The end of year meeting for Healthy Tri Town is where I will be presenting this year’s YRBS results as well as showing the trends between the two years it was administered.
When I was given the project, the presentation was 11 days away, or about 8 work days. The urgency of this report meant it required my entire focus to complete correctly and on time. I had to analyze not one but three data sets: 2015 High School, 2019 High School, and a combined data set of the Middle School Responses from 2015 and 2019. Additionally, one of the data sets was not cleaned, the responses were not ordered correctly, making it unable to be analyzed. This meant spending the greater part of one evening cleaning all of the responses. The intensity of this type of work does not take long to adjust to, it’s just like third week on the block plan. I was asked to hone in on one specific project, and spent most of my waking hours working on it. Only this time, it was for a week instead of one or two days. I ended up dreaming about this data set just as I did my genetics homework during fifth block last year.
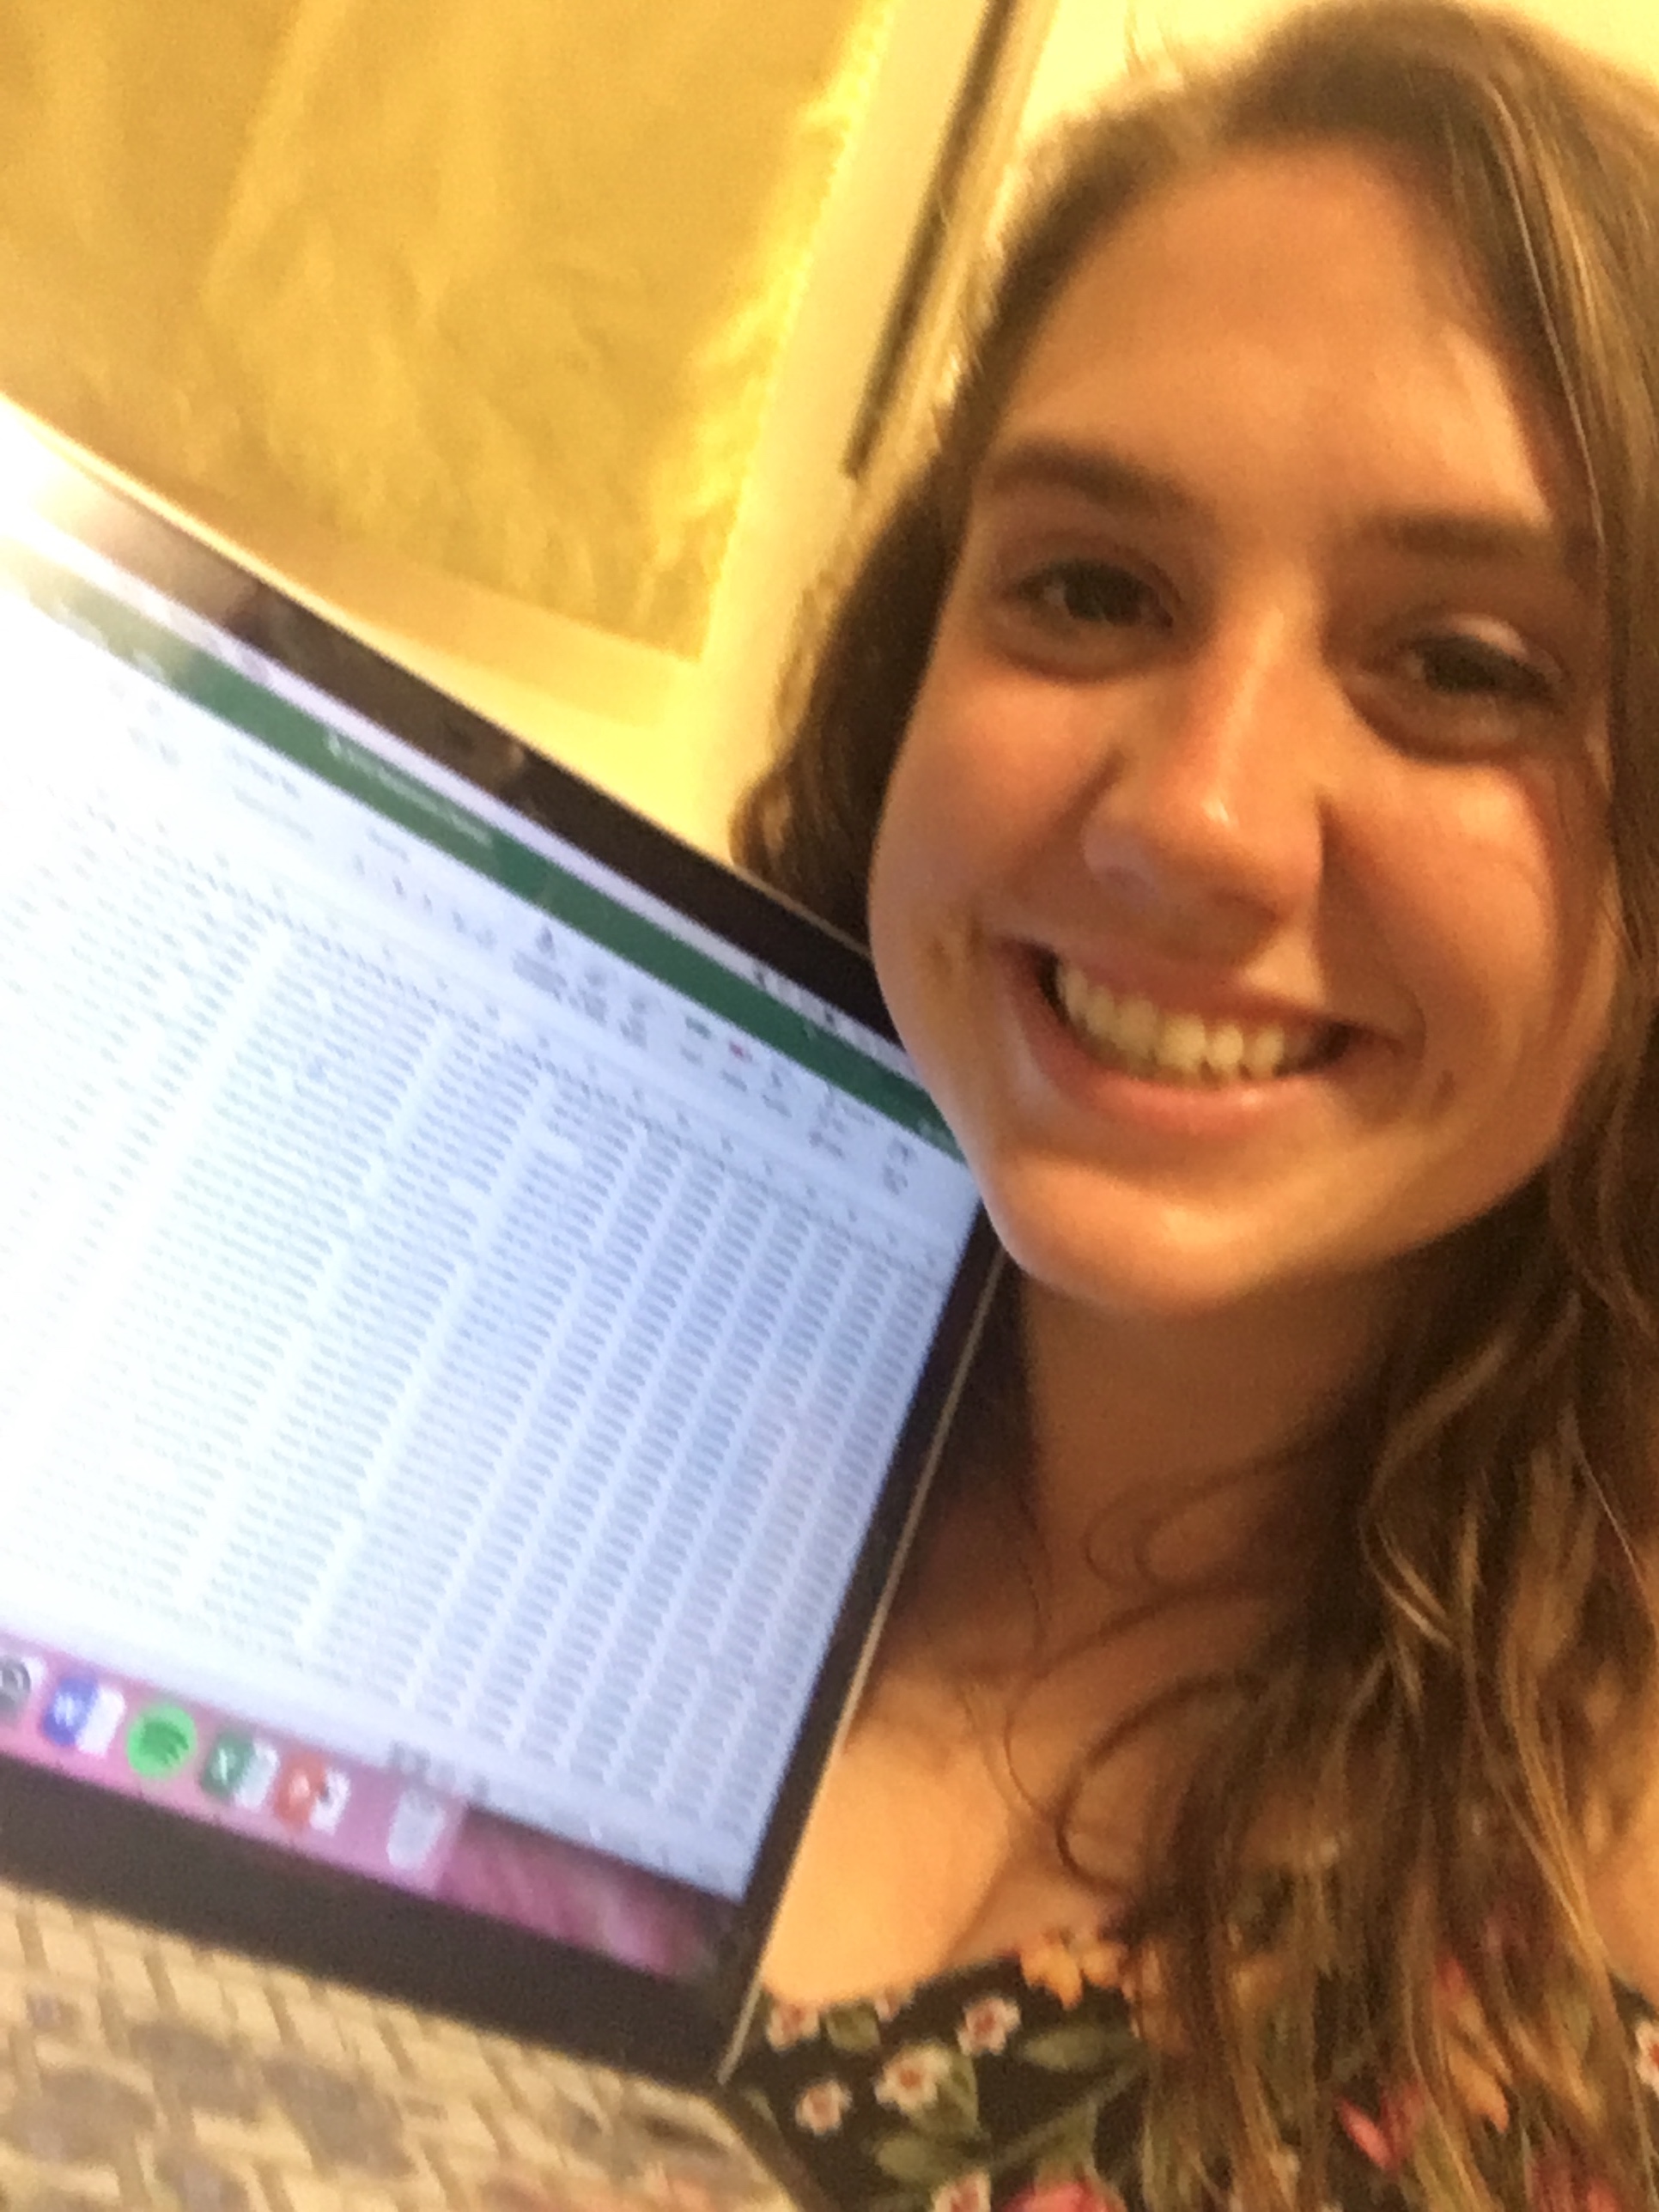
Spending hours moving things around on a spreadsheet can be tedious at times, but the end result is worth it. Out of the 89 questions the 2019 students were asked, I was tasked with analyzing around 72 by age as well as by sex in some cases. Fortunately, my supervisor had copies of a preliminary report conducted by a school official and of the presentation from 2015 to guide me in the expectations with the current data. The tight deadline meant I had little time to run statistical tests on the significance of changes between the years. Only reporting the descriptive statistics made the work much simpler to complete, and still gave me plenty of information to share with the coalition. By the end of the week, I had a rough draft of the presentation completed to send to the superintendent for his approval.
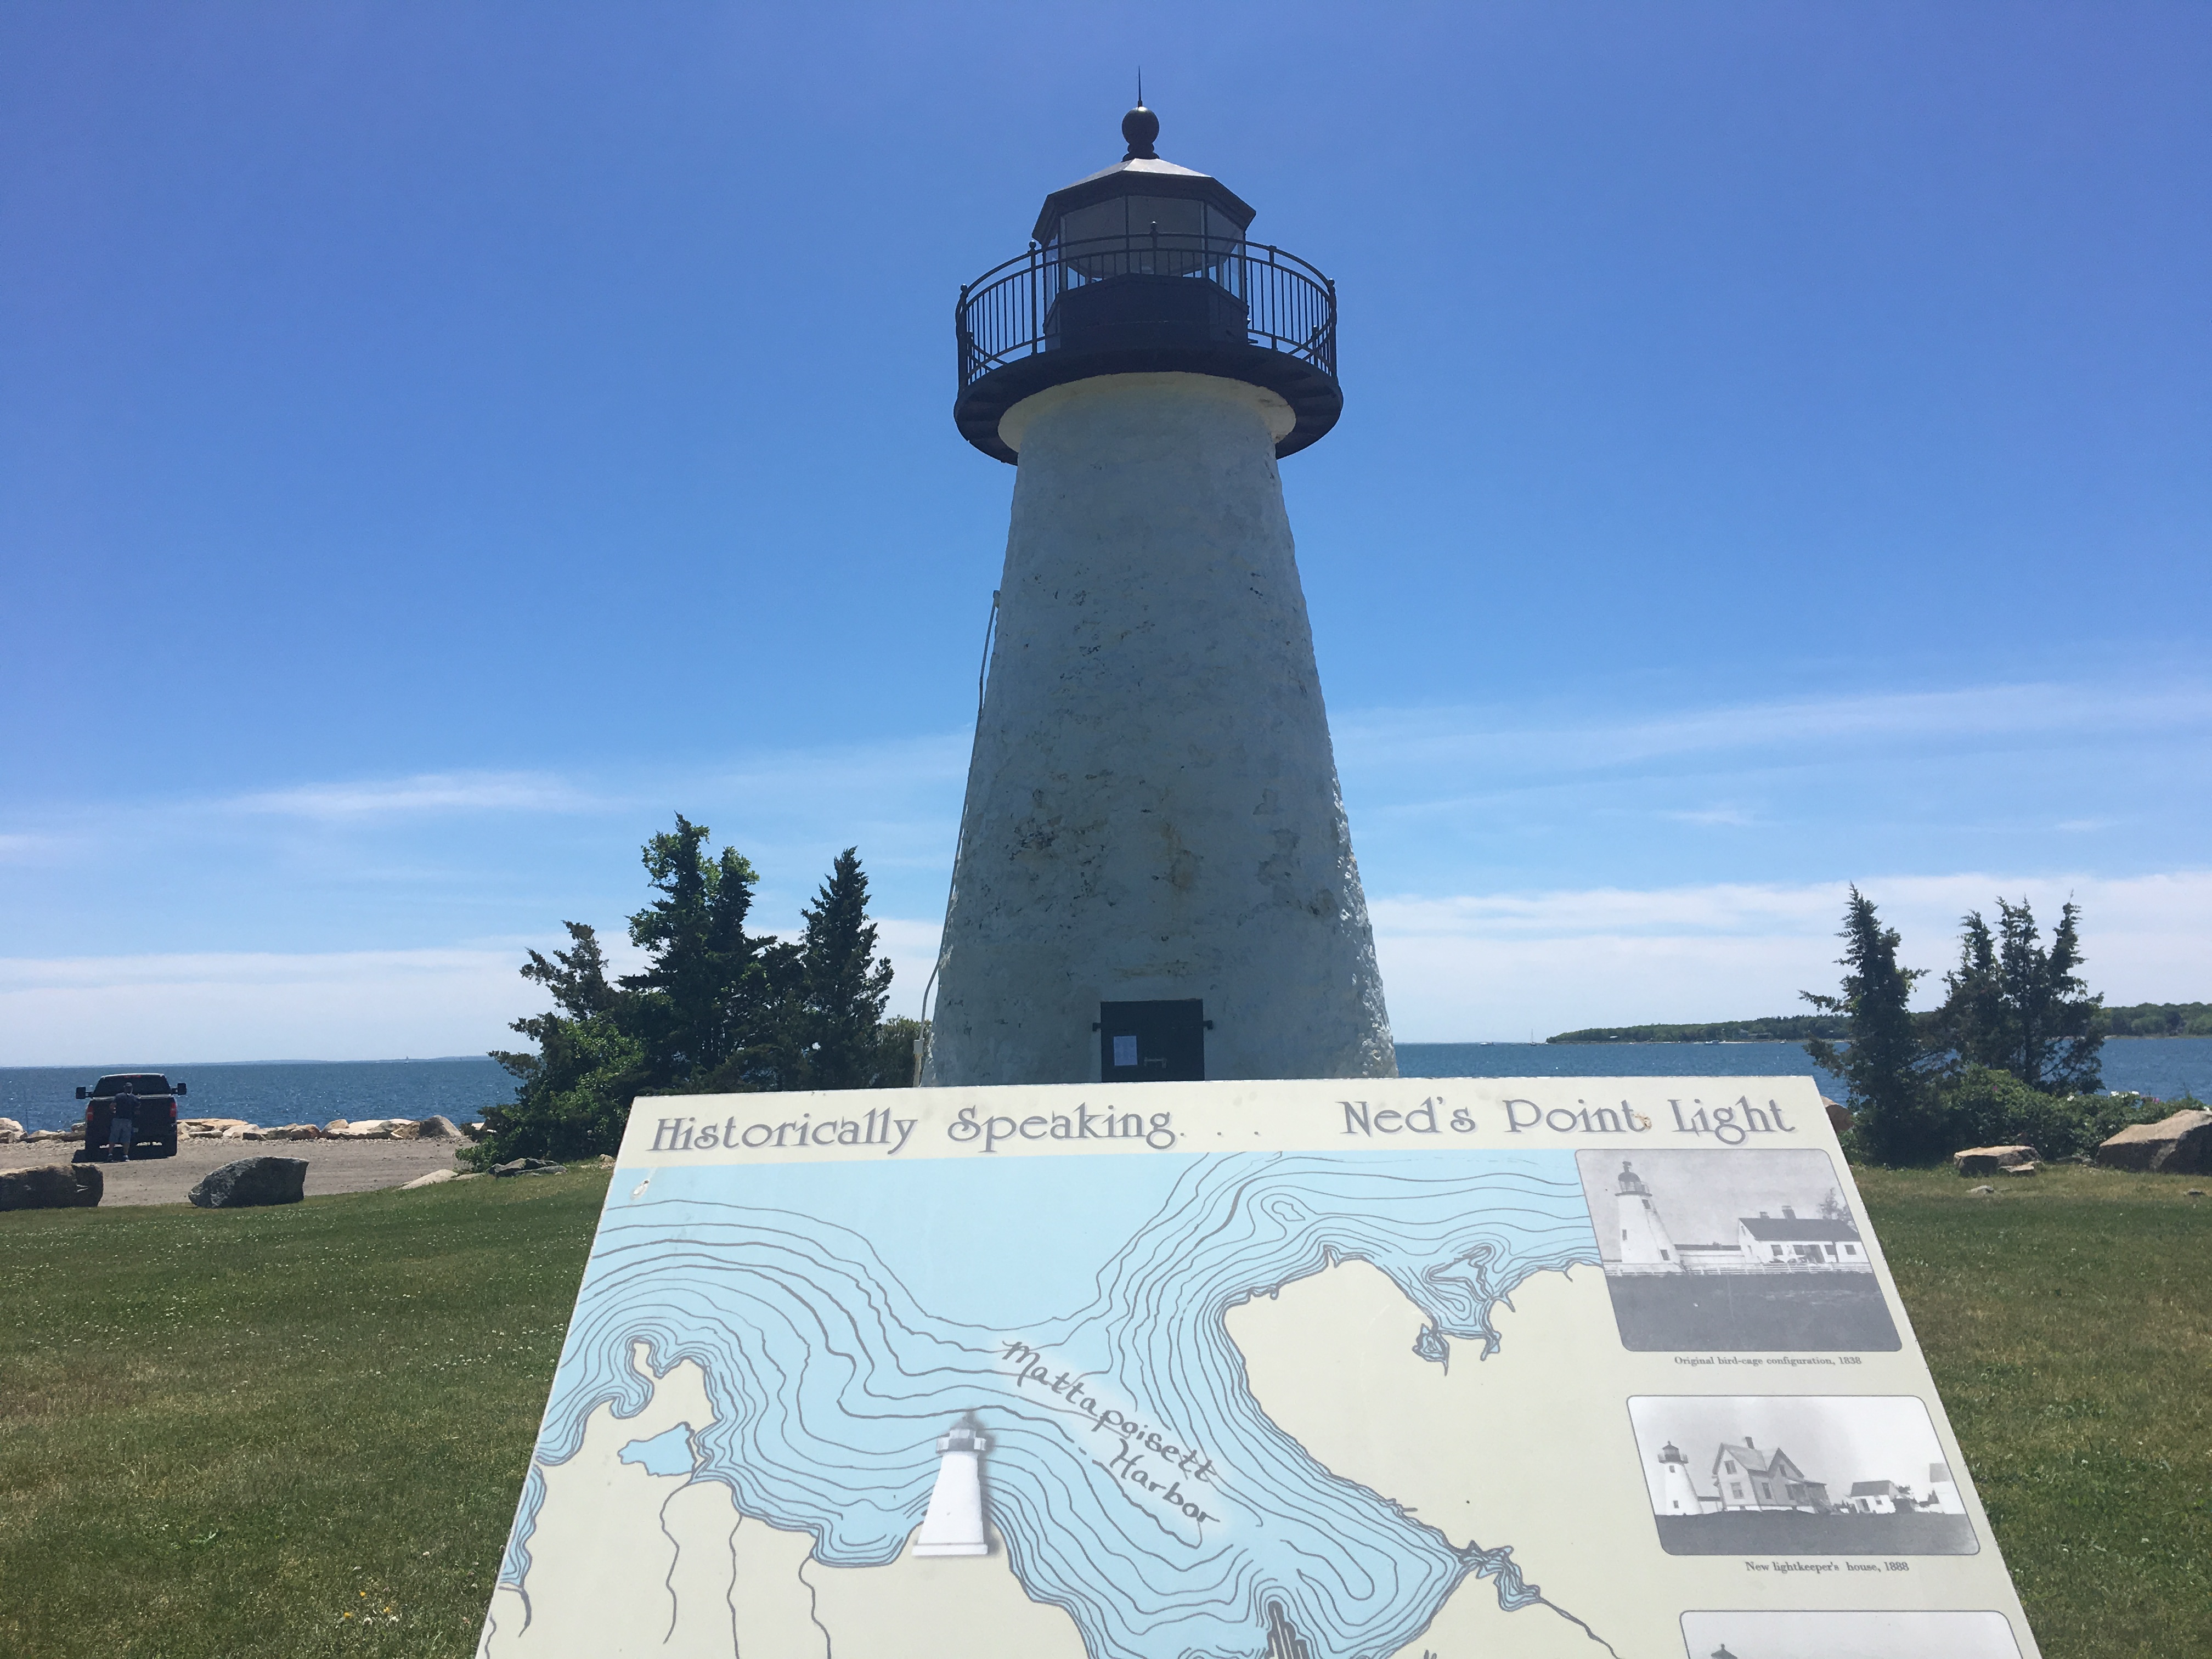
After working most evenings this week, and a good part of the weekend prior on this project, I took a day off. On Saturday, I went to explore more of the surrounding area. Many of those who work in Marion reside either in Mattapoisett, or east of Marion in Wareham. Of the three, I was least familiar with Mattapoisett. Thus, I headed out to the west of Marion, biking on the sidewalk next to the highway until I reached the edge of the town. From there I headed south to see one of their biggest landmarks, a lighthouse. This was the first lighthouse I had ever seen in person. I read a little about its history, and this might sound silly, but based on stock photos of other lighthouses I was expecting it to be taller. Looking out from where it was standing I could see the outline of Cape Cod greeting me in the distance, just like on the Marion beaches.
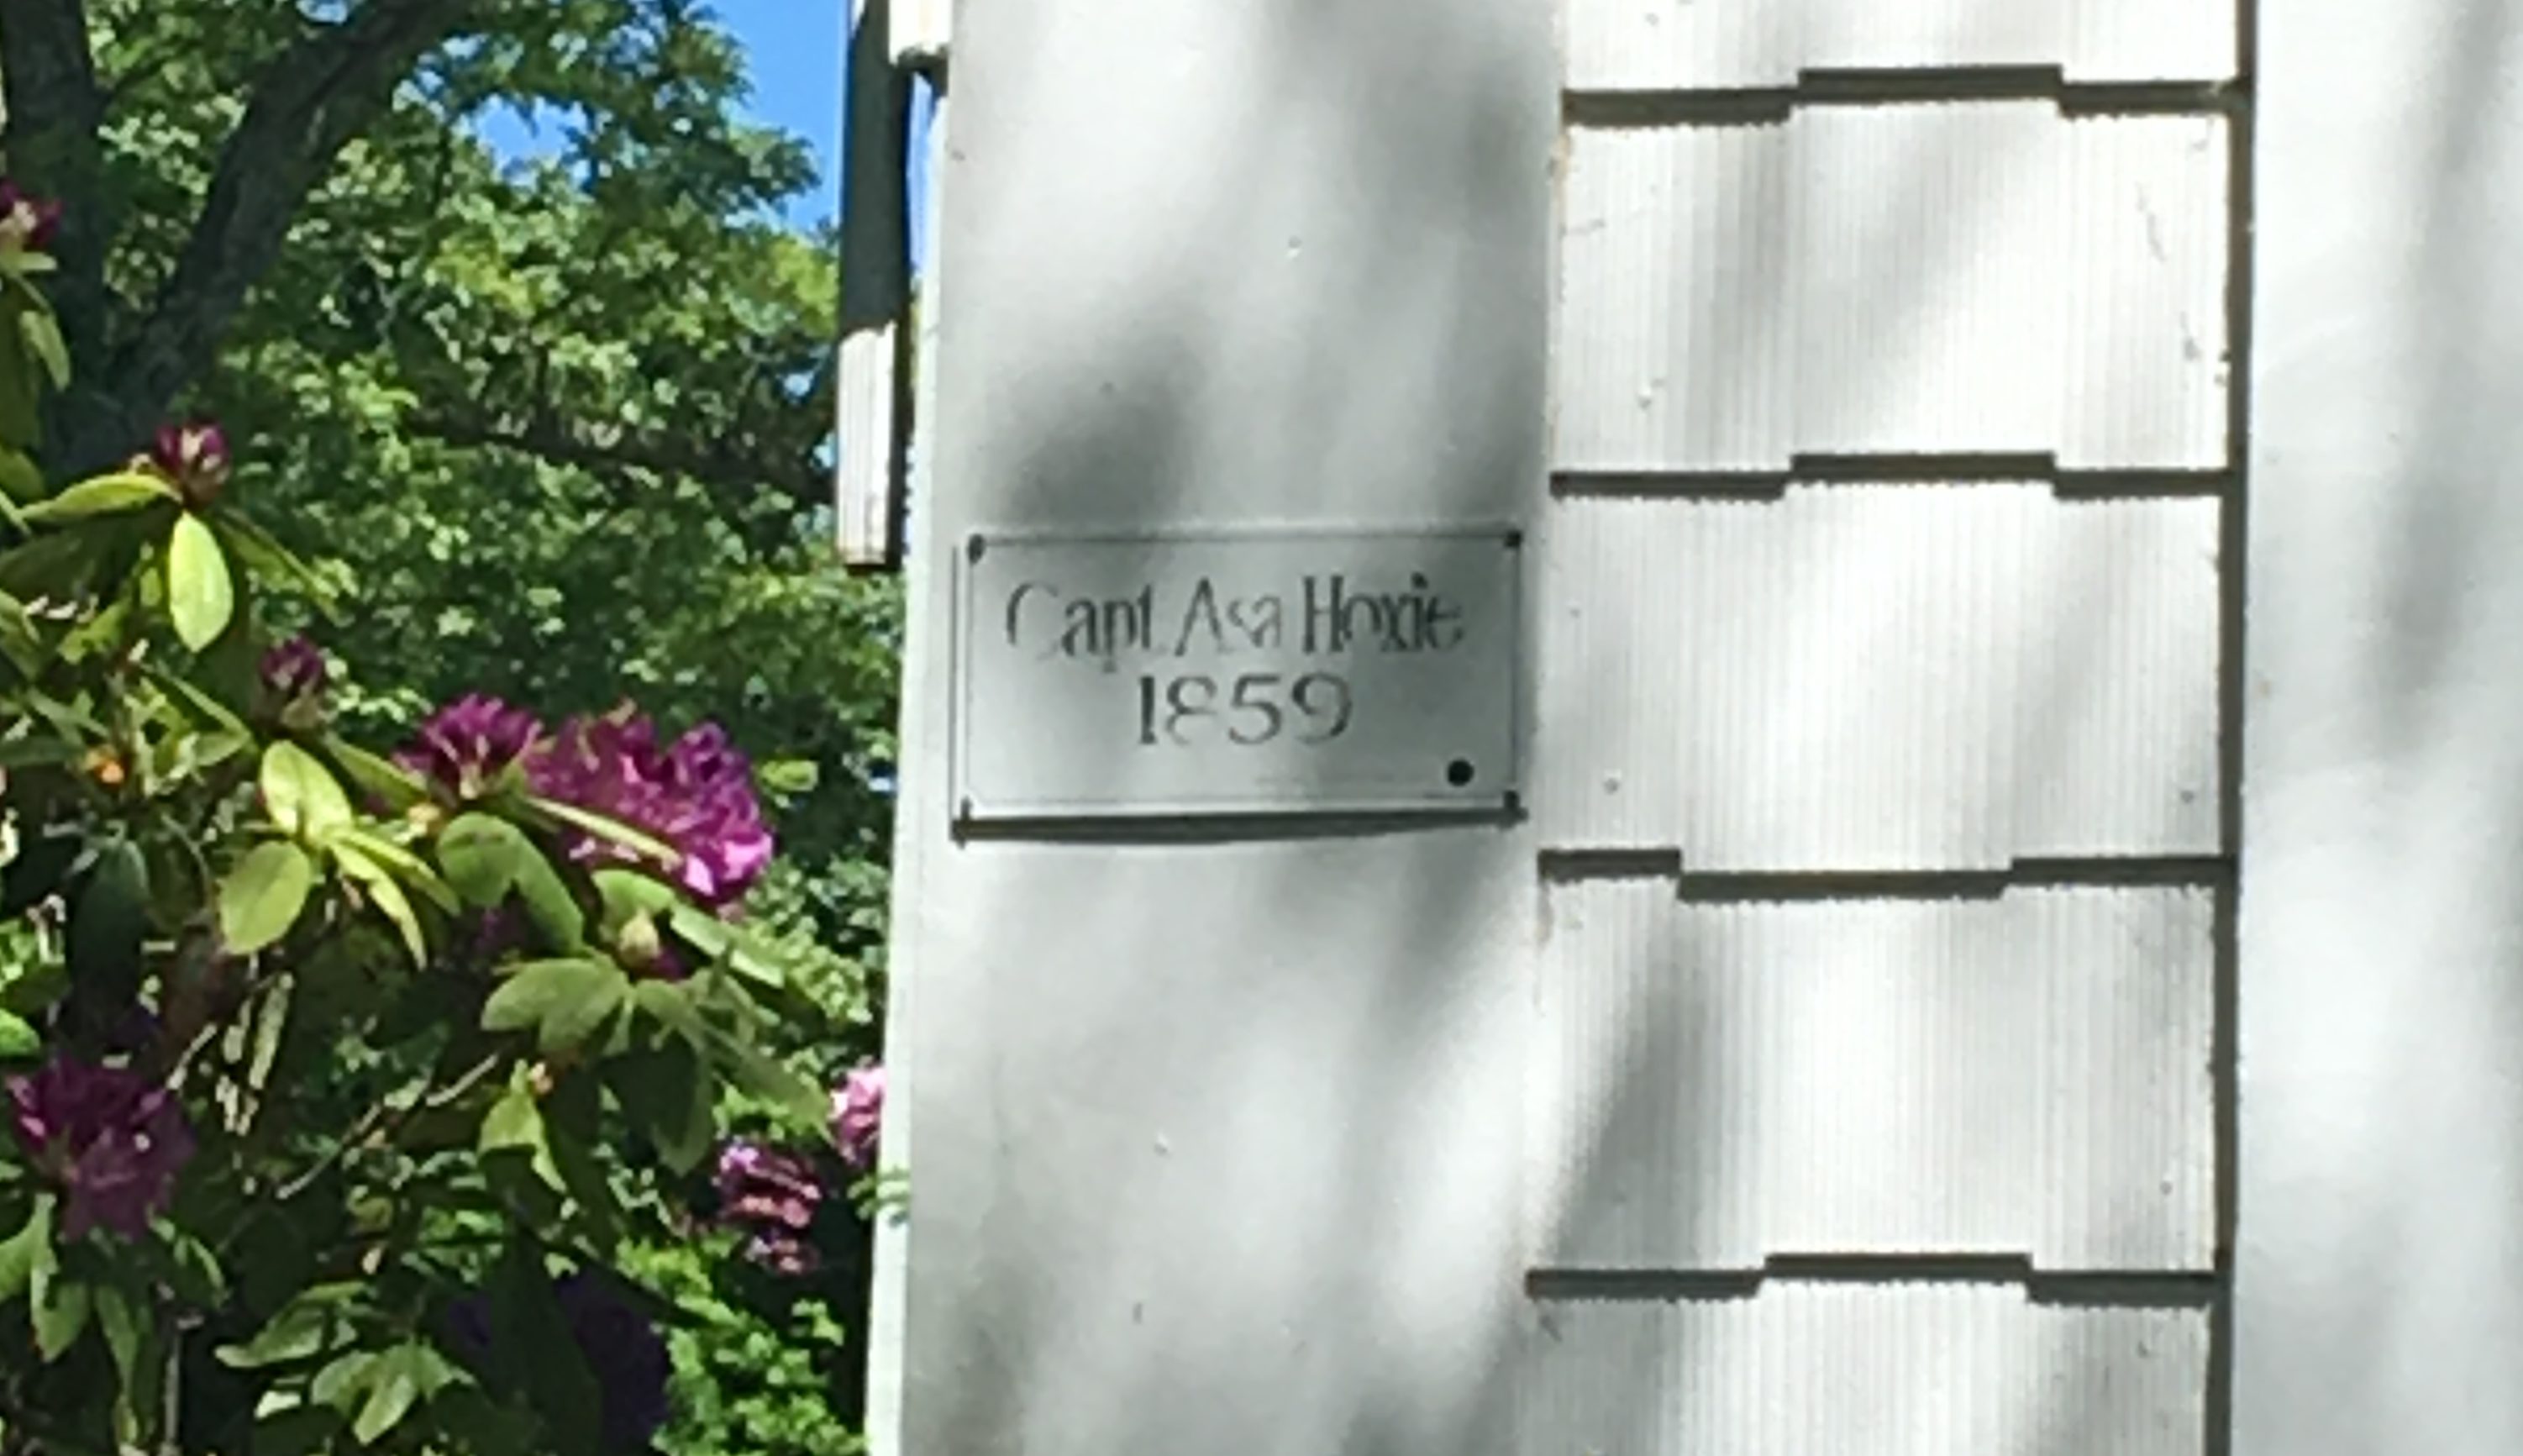
After visiting the landmark, I did a quick bike tour around the main streets of town. The main difference I found between Marion and Mattapoisett was the age of the houses. In both towns, some houses have little signs on them saying when they were built and by whom. They’re interesting to look at and illustrates what either town once looked like. In Marion, there are about 5-10 houses with these signs, but in Mattapoisett, whole streets have houses with these notices. It was an interesting change and definitely not something I’m used to seeing in Minnesota.
Although most of this week was spent focused on one project, I am learning so much! As I mentioned last week, my supervisor kind of has to be a jack of all trades when it comes to public health, she covers everything from tick disease outbreaks and administering various vaccines, to community coalitions and elderly care. It means that every day is different and quiet days at the office are certainly cherished. It’s a lot to do and manage but it’s given me amazing access into understanding all the various facets of public health and my time here has just begun!

MaryJo is a biochemistry major and psychology and sociology double minor from St. Michael, Minnesota.