It's been a few days since I presented my final data. My final data presentation included 27 slides about what I have learned and saw from everything that I did this summer, how it helped me grow, and how I will apply it to my future.
This presentation was more than a capstone for my major, but was a way for me to reflect and analyze everything that I had done this summer. My presentation became my own story of the summer.
Not knowing anything about how a real research lab worked, I walked into the lab eager to learn and contribute to science. Going day by day, creating a weekly schedule to maximize my experiments to get the most done in the short amount of time I had. Being in the setting I was in, I learned and saw how all the steps of an experiment flow together. It was more than just going through the motions of an experiment, but seeing how every step is essential to the final product. Learning new lab skills was an exciting experience every day; trying new tools and instruments made me feel like a professional researcher.
Watch this video of a caption plate reader reading fluorescence of TB metabolism dye to see how much growth occurred.
Once experiments were rolling and I was down to my last few plates, I realized that I was in the thick of it. Conducting the experiments was only the first part of the summer. Now I have 100s of data points that I need to try and analyze. I ended up creating over 84 tables and graphs and five different major graph layouts to try and find the story that the data wanted to tell me. Some major chapters in that story were that the data was very inconsistent. This is exemplified by the lack of replicates and the fact that it is nearly impossible to ask biological samples to be the same every time. Another chapter is that a lot of cells and bacteria died, mostly due to high concentrations of botanicals, creating a toxic environment. Even with this, some promising compounds could have great results with further testing and research. For example, Grains of Paradise and Frankincense.
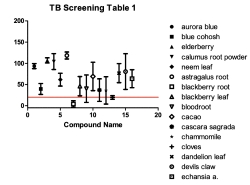
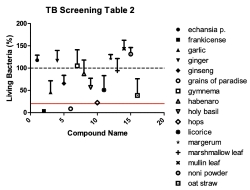
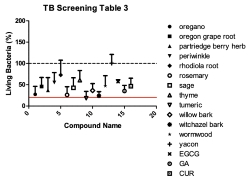
Images TB Table 1, 2, and 3 are final graphs of my TB screenings against botanicals.
I love a good presentation as much as anyone else, but this one was a little different. Dr. Keller’s mentor, Dr. Jane Reusch, reminded me to talk with intention and remember who my intended audience was. I knew that this was not the time to turn my presentation into my comedy show. I had to learn how to keep it light and fun while ensuring my data and information were getting across. I had to put together the puzzle that was my data, find what was important, and what I viewed was worthy of telling everybody else. From here, I was able to narrow down my 48 different compounds to three to four important ones. I highlighted why these were chosen so that future scientists could follow my experiment and see what was valuable.
Long nights, days, and rehearsing in my car had me feeling prepared to knock my presentation out of the park. Which I did!
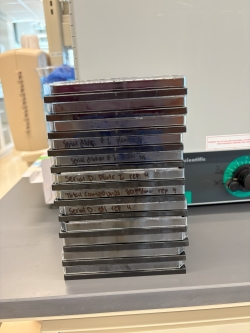 Every plate I created and read for TB throughout the summer. There are 4 total compound plates and 4 replicates of serial dilutions of bioactive compounds.
Thank you to everybody who has followed my journey and assisted me on it. This opportunity will make me a better scientist and a better problem solver in all aspects of my life. The skills that I have learned this summer make me so excited to jump into my higher-level chemistry and biology labs and show off all of my new lab techniques. Not only did I learn lab skills, but also professional skills that will help me decide what I want to be when I grow up and how I will be able to accomplish that.